The p-value is, in a statistical test, the probability to obtain a value at least as extreme as the one observed if the null hypotheses is correct.
For example if the p-value of my statistical test is 0.0124, this means that the probability to get a value at least as extreme as my value is 1.24%. In this case it would mean that either we are on the edge of the null hypotheses distribution or the null hypotheses is wrong.
On the other hand, if my p-value is 0.46, this means that following the null distribution, one half of the output variables would be more extreme than my value (more distant to the mean of the distribution) and one half would be less extreme than it (closer to the mean). In this case the null hypotheses seems to be satisfied.
The p-value is a measure of how extreme a given value is for a given distribution.
A low p-value means that the probability to reject H0 is high and a high p-value means that the probability to reject H0 is low.
Let:
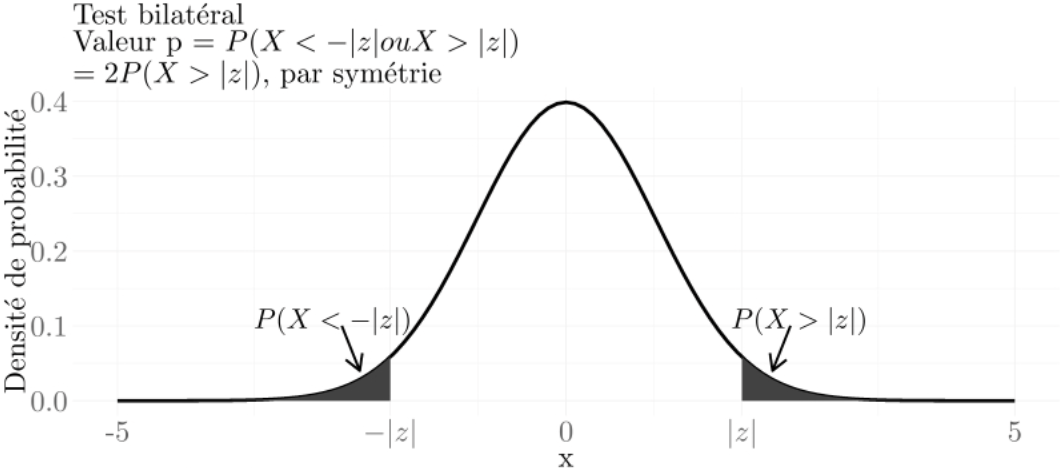
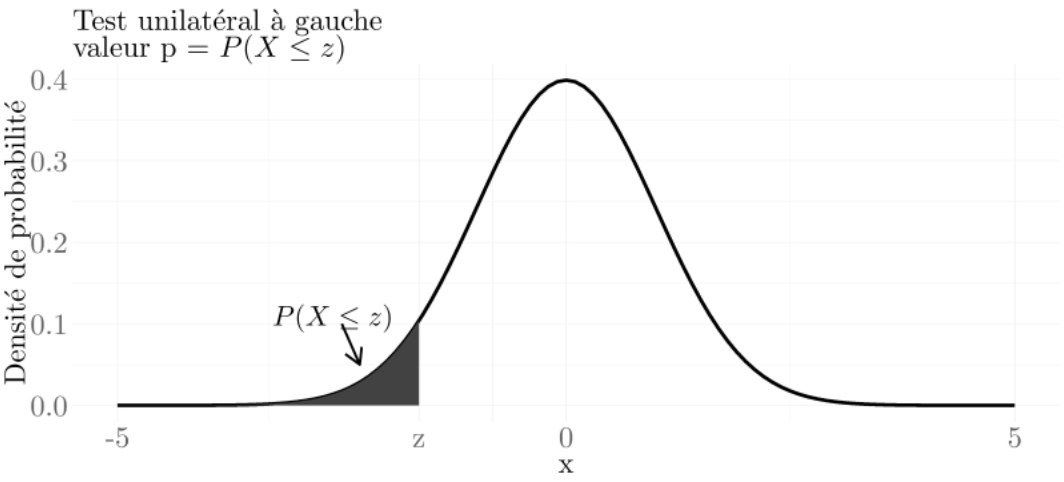
Note that it is the probability to be more extreme than my statistic on any of the side of the distribution.
p-value is obtained through a statistical test. The test will output a statistic that is a value that we compare to the test distribution. To obtain the p-value from this statistic and this distribution we must apply the inverse cdf function on the statistic.
\[p-value={cdf}^{-1}(statistic)\]See: